
Hospitality 2026: Twelve Strategic Shifts Driving Commercial Outperformance
For a complete glossary of hotel industry and strategy terms used in this white paper, open our companion guide in a new tab here.
Executive Summary
Hospitality in 2026 rewards integration over spending. With U.S. RevPAR projected flat to slightly negative and financing costs still elevated, outperformance comes from operators who:
Manage to TRevPAR and GOPPAR, not just ADR
Deploy AI for group pricing and cost forecasting, compressing decision cycles
Build high-margin partnership ecosystems beyond the room
Align labor deployment with hourly revenue curves using predictive scheduling
Synchronize portfolio pricing and procurement while preserving local service identity
Leverage ESG credentials to win corporate RFP share and reduce utility spend
Migrate to cloud infrastructure for real-time visibility and faster integration
Protect direct channel contribution through loyalty economics and friction-free UX
This blueprint provides twelve strategic shifts and actionable Billy Richards Consulting frameworks to operationalize within 90 days. The competitive edge in 2026 belongs to those who execute, not those who plan.
Introduction
Hospitality in 2026 is reshaping itself under the combined weight of cost inflation, fast-moving technology cycles, and a demand environment that varies by market and segment week to week. Many portfolios are now managing through slower rate growth and uneven occupancy while energy and payroll remain elevated. Recent outlooks reflect this reality. Independent researchers and banks have trimmed growth expectations for the United States through 2026, with some sources now calling for flat to slightly negative revenue per available room for the full year as higher prices meet softer pace and as corporate travel remains selective.

The Peninsula Istanbul Waterfront icon that blends heritage and modern luxury while anchoring mixed use revitalization along the Bosphorus
Global travel demand is still a bright spot. The United Nations World Tourism Organization reported that international arrivals recovered to pre-pandemic levels in 2024 and it projects additional growth of approximately 3% in 2025. That is an important tailwind for gateway cities and for destinations that depend on long-haul travelers. UNWTO. What’s next for 2026?
As we enter 2026, operators face a bifurcated landscape: gateway cities with strong international demand versus secondary markets managing softer corporate travel. The December 2025 Fed rate cut provides financing relief, but execution discipline—not capital availability—will separate outperformers from the field. At the same time the operating picture is complicated by persistent staffing challenges.
As of mid-2025, the American Hotel and Lodging Association reported that approximately 65% of surveyed hotels continued to face staffing shortages even after a year of improved recruitment and higher pay. The same association noted that employment is expected to grow in 2026 but that retention and new technology adoption remain critical to success. Immigration remains an important source of labor supply for the sector according to a June 2025 analysis. AHLA+1Reuters
Owners and operators who outperform in this environment are the ones who weld revenue science to asset strategy, who align labor with revenue moments, who move to cloud infrastructure for speed and reliability, and who treat partnerships and brand extensions as real growth levers rather than side projects. This document presents twelve strategic shifts and a complete set of BRC Action Frameworks so you can implement without guesswork.
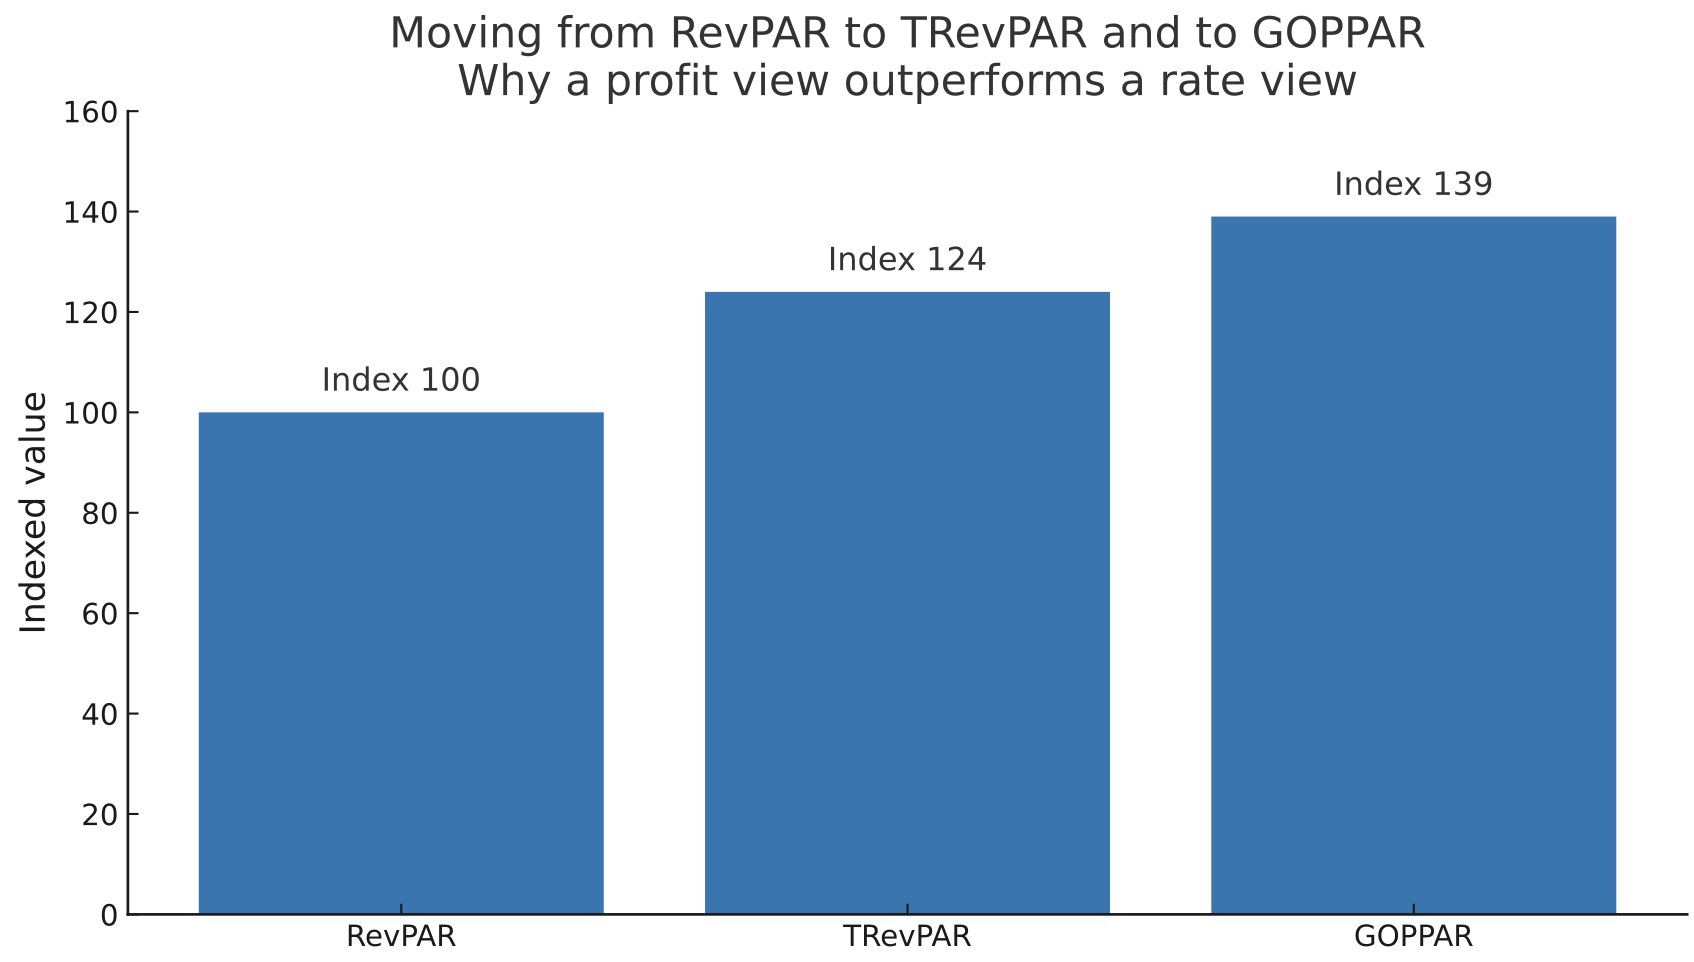
Managing to total revenue and to profit produces a truer view of performance than rate alone
(Concept index for communication. Not a market dataset. Replace with property or portfolio metrics if required.)
Methodology & Data Sources
This analysis draws on November–December 2025 industry reports from STR, CBRE, HVS, AHLA, UNWTO, and Cornell School of Hotel Administration. 2026 projections reflect consensus views across investment banks, valuation firms, and hospitality research institutions. Where data points reference 2025 performance, they represent the most recent available figures as of publication and are used to inform 2026 strategic positioning. All recommendations are designed for immediate implementation within Q1–Q2 2026.
One. Advanced Revenue Architecture and Dynamic Profit Management
Revenue per available room is no longer sufficient to steer a complex business. Leading portfolios manage to Total Revenue per Available Room and to Gross Operating Profit per Available Room because these measures capture both the scope of income and the cost required to earn it. Properties that adopted a total revenue lens during the last cycle reported meaningful profit lift by expanding the commercial plan to include food and beverage, spa, meetings, retail, parking, and in stay experiences. The modern revenue office operates as a profit center that unites sales, marketing, operations, and finance around one forecast that spans all lines.
Execution requires integrated data. Revenue management platforms must pull from property management, point of sale, labor, and customer relationship systems so that price and inventory decisions reflect real cost to serve and real attachment rates. Rate fences, room type mix, and add on offers should be tied to measurable changes in margin by segment and by channel.
Billy Richards Consulting Action Framework
Conduct a commercial architecture audit across property management, revenue management, point of sale, and customer systems. Build a single forecast that includes rooms, food and beverage, spa, events, parking, and retail. Replace weekly rate reviews with weekly profit reviews and track contribution by segment and channel with visible error bounds.
Two. Capital Efficiency and Asset Repositioning
With capital more expensive and selective, owners are favoring targeted repositioning over broad renovation. The most effective projects are those that convert under used footprints into higher yield concepts or that create premium room types with clear reasons to pay more. Examples include wellness suites that command stronger average daily rate, technology-rich meeting spaces that attract hybrid events, and curated retail that matches the guest profile. Independent valuation research shows that hotel values in Europe rose about 2.5% in 2024 as occupancy recovered and rate normalized, which underscores how targeted asset moves can support value even in a slower growth year. HVS
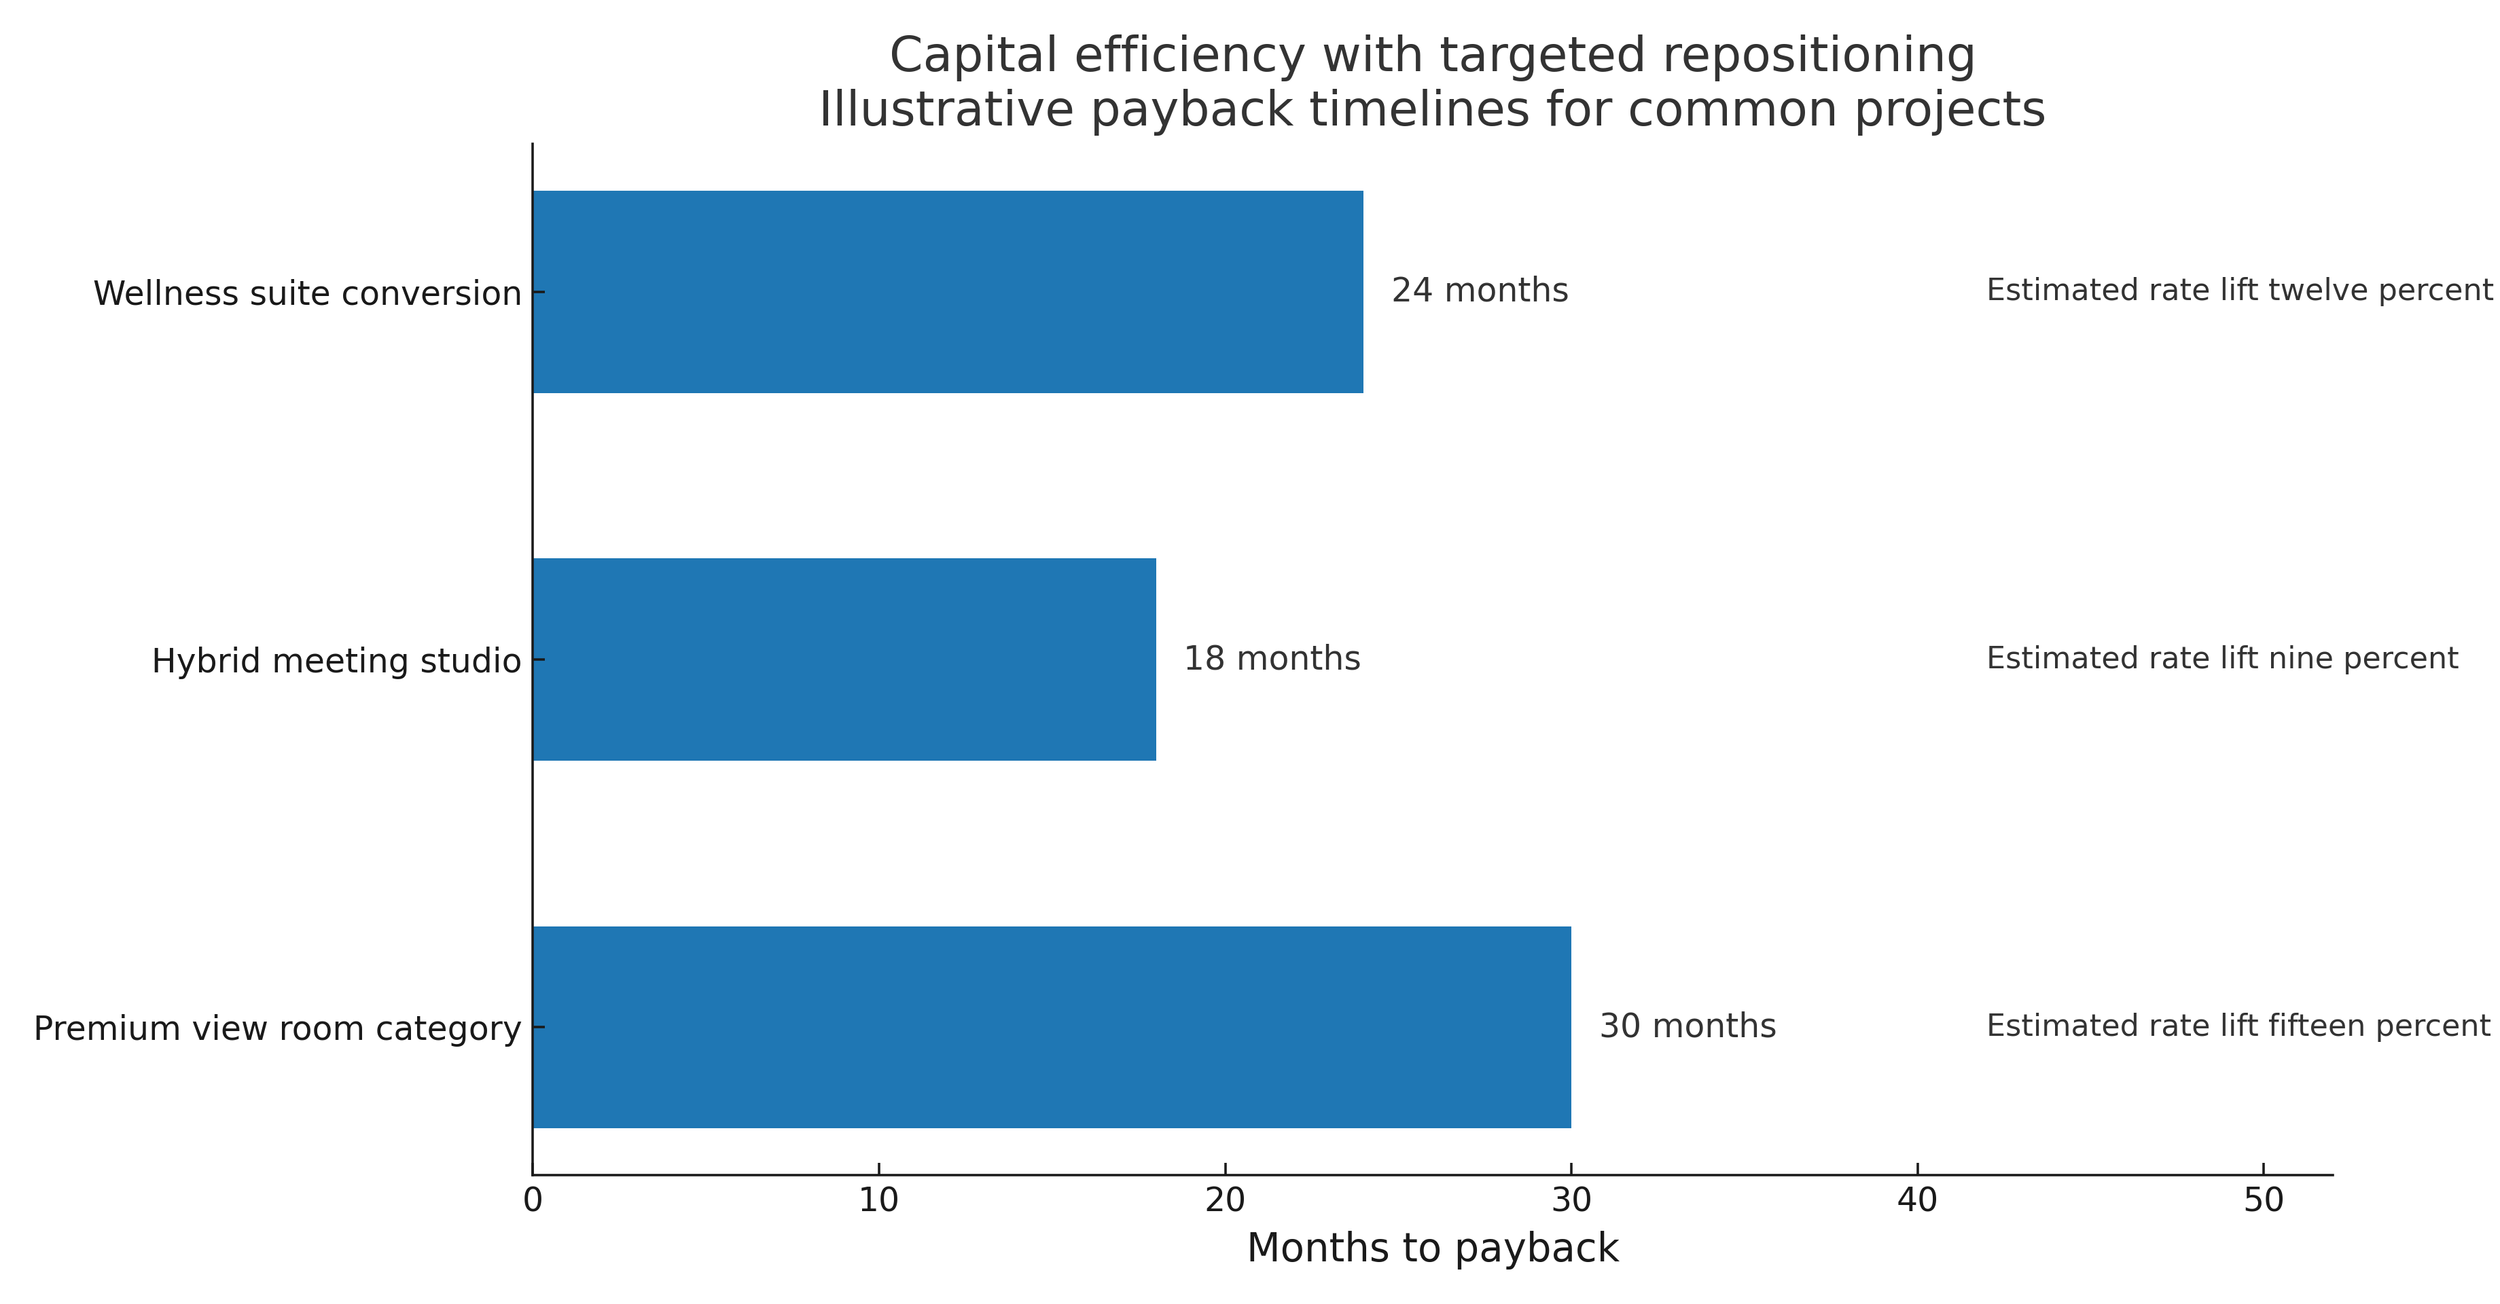
Targeted repositioning delivers faster payback than broad renovation when tied to real demand
(Illustrative values for communication. Replace with market or property data if required.
Inputs reflect common ranges reported by respected industry sources including HVS hotel cost guides and wellness revenue analyses from RLA Global and HotStats.)
Every dollar must be tied to a demand pool and a pricing story. A disciplined playbook models internal rate of return and payback under base and downside scenarios and it quantifies expected uplift by room type category and by ancillary line. Owners should also score the operational effect, including the cost of utilities and maintenance under the new concept.
Billy Richards Consulting Action Framework
Run a property level demand gap study that pinpoints the segments you can credibly win. Build an investment case with internal rate of return, payback, and displacement effects by month. Phase the program so that early wins fund later work and publish a monthly variance report against the pro forma.
Three. Artificial Intelligence Decisioning and Predictive Commercial Intelligence
Artificial intelligence is now a practical engine of commercial performance rather than a laboratory project. Hotels that adopted artificial intelligence for group pricing cut proposal times by large margins and lifted conversion. Similar systems predict attrition in corporate accounts and loyalty segments so that sales teams can intervene before spend declines. Others forecast cost to serve by booking type and arrival pattern which allows operations leaders to plan labor and purchasing more accurately. These improvements matter as operators face uneven performance heading into 2026. Mid-2025 data from STR showed U.S. occupancy near 64%, ADR around $160, and RevPAR essentially flat, reinforcing the need for precision tools as markets remain selective. STR
Artificial intelligence projects require clean data and governance. A pricing council that includes revenue, finance, sales, and brand should review outputs, monitor model drift, and ensure fairness. Start narrow, prove lift within a quarter, and scale only after wins are banked.
Leading revenue management vendors including IDeaS, Duetto, and Revinate now embed predictive AI as standard features, lowering adoption barriers for mid-market portfolios. Expect 2026 to be the year AI moves from pilot to production across forecasting, pricing, and guest personalization use cases.
Billy Richards Consulting Action Framework
Select one high value use case with solid data quality such as group pricing or demand classification. Deliver a ninety day proof with measured impact. Create a governance charter for model oversight and document decisions in a scenario log so leaders learn where the machine is strong and where human judgment must lead.
Four. Cross Sector Partnerships and Ecosystem Monetization
A hotel is a destination and a platform. Partnerships with retail, wellness, entertainment, and education can create high-margin revenue streams and strengthen brand differentiation. In practice this means a lobby that hosts a luxury retail capsule, a spa that carries a co-created product line, a calendar of cultural programming that is underwritten by partners, and event spaces that serve hybrid audiences both on site and online. The strongest programs present a coherent story that matches the property identity and the audience.
A successful partnership portfolio uses clear unit economics. Space is priced in revenue per square foot per hour and agreements balance guaranteed rent with revenue share where appropriate. Operational plans detail staffing, service standards, and merchandising. Data and marketing calendars are shared so that both sides can measure results and optimize.
Billy Richards Consulting Action Framework
Write a partnership thesis for each market that names target categories and partner profiles. Create a valuation grid for space and time. Choose between fixed rent, revenue share, or hybrid based on risk and return. Require joint planning, rights for data review, and defined performance thresholds for renewal.
Five. Labor Model Reinvention and Technology Enabled Productivity
Labor is the largest controllable expense and the most visible driver of the guest journey. The goal is not simply to cut hours but to align staffing with the revenue curve of the day and of the week. The sector still faces shortages. AHLA's Q1 2025 survey reported that 65% of U.S. hotels faced staffing shortages, a challenge that persists into 2026 despite wage increases averaging 4–6% year-over-year. AHLA+1 Employment is expected to grow in 2026 but retention and upskilling will matter as much as recruitment.
Winning operators rely on demand-linked scheduling, mobile work management, and streamlined guest technology for simple tasks. This frees colleagues for higher value interactions such as personalization, cross selling, and problem resolution. Cross training expands flexibility during peaks. The right scorecard joins labor cost, guest satisfaction, and ancillary attachment so teams can see the tradeoffs and make better daily decisions.
Billy Richards Consulting Action Framework
Implement a property productivity index that combines cost per occupied room, satisfaction scores, and in stay revenue attachment. Drive scheduling from the integrated forecast. Automate routine service flows and coach teams on simple talk tracks that reveal needs and position relevant add ons.
Six. Multi Asset Portfolio Synchronization
Scale produces advantage only when decision rights and data are centralized while local service remains personal. Portfolio leaders run a command center that unifies pricing rules, inventory strategy, marketing investment, and data governance. They share winning creative across properties and they coordinate regional promotions to manage demand across the set. This approach matters because growth has become uneven across markets. While the United States has experienced slower momentum at points in 2025, several South American markets have posted consistent revenue per available room gains through the year to date period supported by both rate and occupancy. Coordinated strategy allows owners to lean into out performing regions while supporting assets that face softer conditions. STR
A synchronized portfolio also consolidates procurement and energy programs to capture cost savings and to support environmental goals. Shared identity resolution and privacy controls reduce compliance risk and improve the quality of analytics across the group.
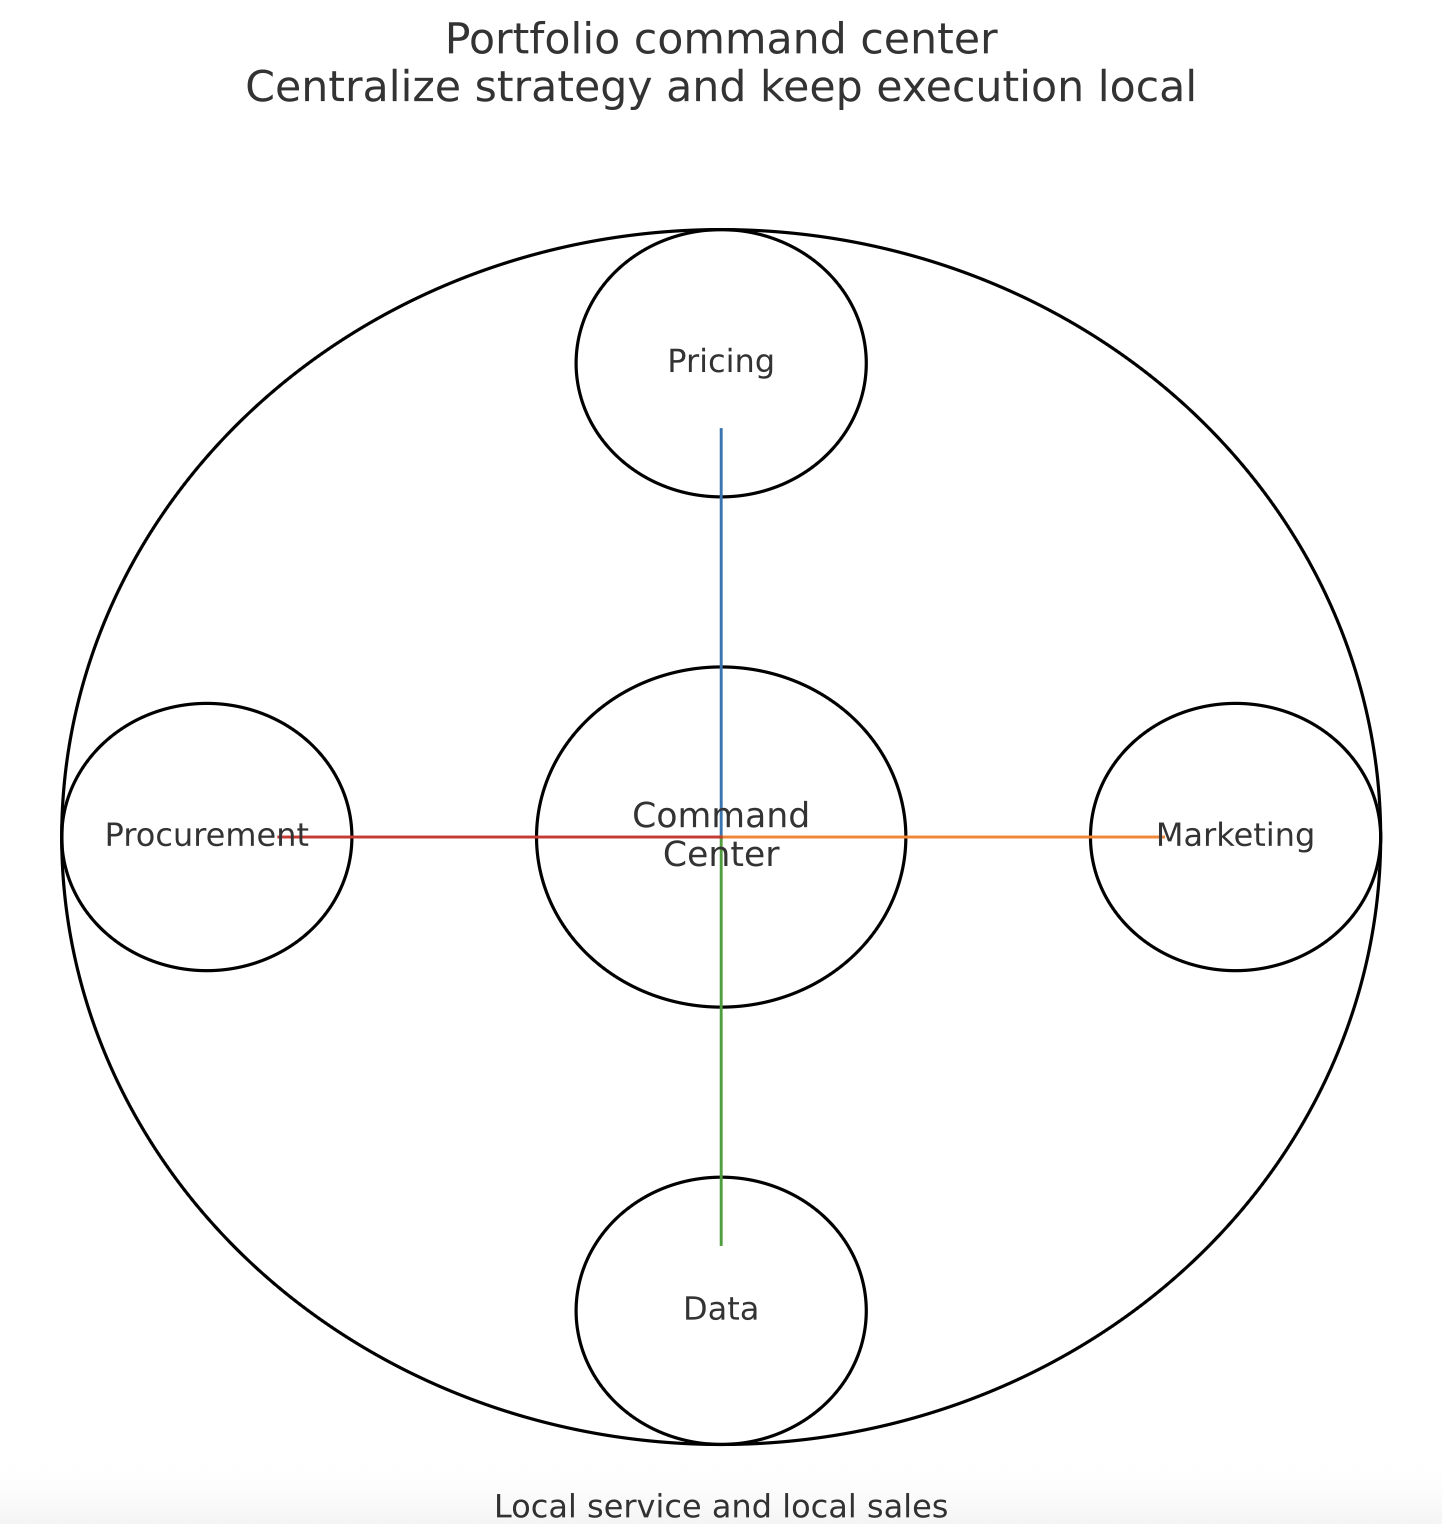
One governance model unites pricing, marketing, data, and procurement, while local teams execute service and sales
Billy Richards Consulting Action Framework
Stand up a portfolio command center with standard operating rhythms. Install a shared data warehouse with common definitions and one dashboard. Publish a weekly report on mix, share, and margin. Replicate successful offers across the set within weeks, not quarters.
Seven. ESG as a Commercial Lever

1 Hotel Brooklyn Bridge Urban sanctuary with a sustainability story that turns skyline views into brand equity and premium demand
Environmental, social, and governance performance is no longer a side conversation. It influences corporate request for proposal outcomes, investor interest, utility spend, and brand preference. The commercial upside is real. Cornell and NYU hospitality research confirms that LEED and Green Key certified hotels command 2–5% ADR premiums in competitive sets, with corporate RFP win rates 15–20% higher for properties with verified environmental credentials. Major chains including Accor and IHG have committed to portfolio-wide third-party certification by 2030, accelerating the competitive pressure on independent operators to match sustainability standards. Corporate travel programs have begun to reward measurable progress, with some initiatives showing higher win rates for hotels that can document credible environmental actions. Accor GroupSiteMinder
The sequence below shows the path from baseline utilities to net annual cost after energy and water savings:
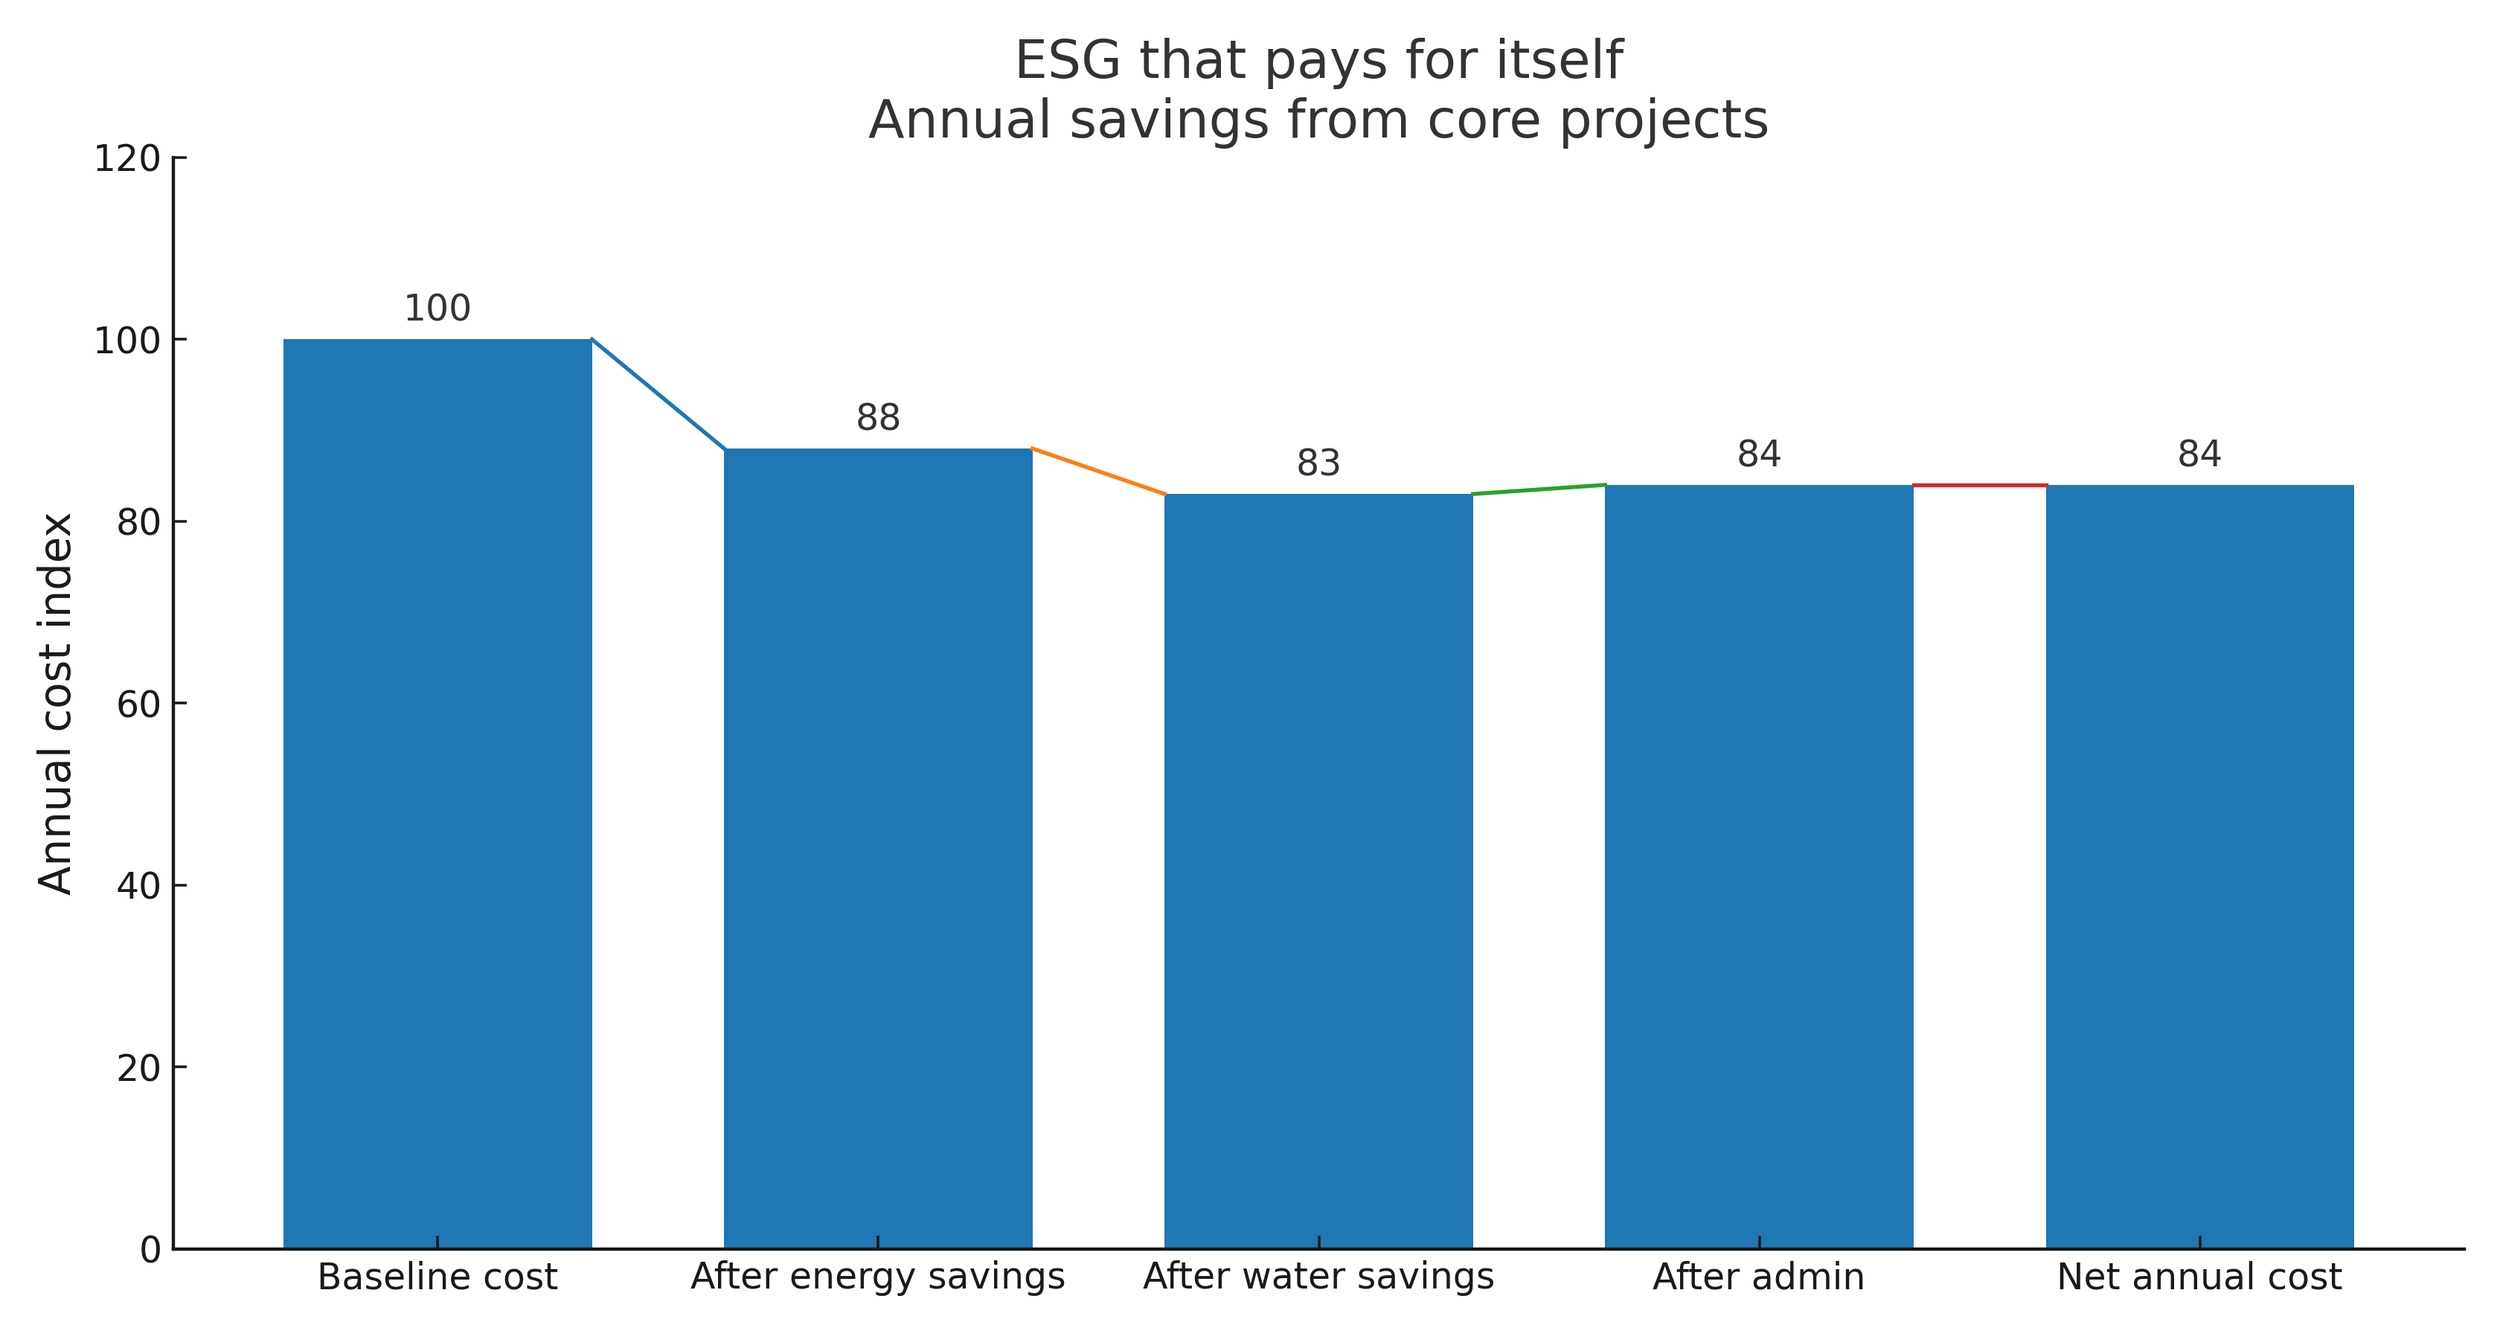
Well-planned ESG work lowers cost and supports rate
(Illustrative values for communication. Replace with property data if required.)
Regulatory pressure is also rising in large cities, where emissions limits for buildings tighten through the decade. This further aligns sustainability with margin management since energy programs reduce both emissions and expense. Thoughtful storytelling turns these operational moves into rate support while also strengthening loyalty and employee retention.
Billy Richards Consulting Action Framework
Create a three year plan that quantifies expected effects on rate, corporate win rate, and utilities. Link ESG metrics to executive incentives. Report ESG in the same dashboard as financial metrics and show the operational projects that drive both carbon reduction and cost savings.
Eight. Resilience Through Cloud-Based Infrastructure
Portfolios that run on cloud systems move faster, integrate more easily, and gain real time visibility across the enterprise. Cloud-based property, revenue, and customer systems collapse deployment timelines for new features and for new properties and they reduce technology debt through modular updates. Several groups that completed migration reported lower information technology run costs and faster onboarding of new hotels. The benefits are particularly important in a year when operators need to spot softening pace early and react with precision. Industry research in mid-2025 highlighted quarters where modest rate growth was offset by lower occupancy which reinforced the need for live analytics and rapid response. CBRE
A modern stack uses event streams and application interfaces so that demand signals, rate decisions, and service events can connect without manual handling. Identity and access controls are standardized across all systems. Batch reporting is replaced by live dashboards configured for executives and for property teams.
Billy Richards Consulting Action Framework
Prioritize migration for the commercial stack first so the business case is visible. Map integration requirements, assign clear owners, and set service levels. Tie each technology milestone to a commercial metric such as forecast accuracy, lead time, direct mix, and labor productivity.
Nine. Revenue Diversification Through Licensing and Brand Extensions
Hospitality brands with strong equity can extend beyond the property to create new high-margin lines. Product families that relate to the property story such as sleep products, fragrance, homeware, and culinary goods build emotional connection and also generate incremental profit with relatively low operating complexity. Co-branded credit instruments and retail partnerships can add scale and marketing reach while feeding data back to the core loyalty program.
The key is discipline. Category selection should reflect the guest demographic and the brand promise. The financial model must include quality control, distribution, and marketing allocations. Post launch, the team should track attachment between product customers and on property revenue to confirm that the extension strengthens, rather than dilutes, the brand.
Billy Richards Consulting Action Framework
Complete an intellectual property valuation and category screen. Select two priority categories with strongest fit and one test category. Negotiate quality standards and distribution rights. Reinvest part of the profit into shared media that supports both the product line and the hotel.

The Calile Brisbane Lifestyle-led architecture where retail and programming drive strong ancillary revenue and repeat visitation
Ten. Data Monetization and Commercial Intelligence Products
Hotels produce valuable information about demand patterns, spend behavior, and seasonality. Leading groups now generate $50K–$250K annually from anonymized data products sold to tourism boards and regional airlines seeking booking pattern insights. Some portfolios have also collaborated with destination marketing organizations to co-produce analytics that help both sides capture share during key periods. The guardrails are essential. Programs must honor privacy laws and brand promises. Data sets should be structured to remove personally identifiable information and to present trends at a level that is commercially useful without exposing individuals. Properly designed, these products create a recurring revenue stream and position the brand as a thought leader in its city or region.
Billy Richards Consulting Action Framework
Establish a data trust that defines access, purpose, retention, and pricing. Package anonymized data into quarterly or monthly reports with clear metadata. Price by geography, frequency, and depth. Obtain legal and brand approvals and publish a transparent data statement for customers.

Aman Tokyo Quiet power and precision design that signal premium positioning and pricing authority in a global gateway city
Eleven. Pricing Governance and Commercial Risk Management
Dynamic pricing is essential in a slower growth year, but it carries real brand risk if handled without discipline. The answer is to install a formal governance process that protects rate integrity while still allowing for speed. A council formed by revenue, finance, sales, and brand leaders sets floors and ceilings by segment, defines approval limits, and reviews exceptions monthly. Stress testing against scenarios such as event cancellations or macro slowdowns helps leaders avoid reactive discounting. This matters because 2025 industry forecasts from CBRE and Business Travel News project continued pressure on 2026 growth, with several sources anticipating flat to modest RevPAR performance as operators manage rate integrity against softer demand signals. CBREBusiness Travel News
Governance also includes communication to frontline teams and to owners. Sales managers need clear deal desk rules and alternatives to rate, such as value adds, that do not erode contribution. Owners need transparent reporting that shows the consequences of overrides at the booking class level so that tradeoffs are visible and rational.
Billy Richards Consulting Action Framework
Publish a pricing charter with explicit rules and decision rights. Hold a monthly review to assess exceptions, customer feedback, and model drift. Track the profit effect of each override and use the findings in coaching and in next year planning.
Twelve. Direct Distribution and Loyalty Economics
Direct bookings improve margin and produce better data for personalization, but only if the value exchange is clear and the journey is effortless. The American Hotel and Lodging Association projected that average daily rate in the United States would set a new high in 2025 at just over $162. That higher price point raises the stakes for friction-free direct purchase and for loyalty benefits that customers actually want. Perks such as late checkout, a simple dining credit, or a room feature choice often carry lower cost and higher satisfaction than broad discounts. AHLA With the Federal Reserve's December 2025 rate cut, AHLA projects that 2026 ADR will exceed the 2025 high of $162, supported by improved financing conditions for development and acquisition activity. This monetary tailwind positions well-capitalized owners to capture share through targeted repositioning and direct channel investment.
A balanced channel strategy still uses intermediaries for reach and for specific segments, but it aims to move repeatable demand into direct channels where contribution is stronger. Paid media must be measured with clean attribution to ensure that spend follows profitable audiences. Lifecycle communication before the stay, during the stay, and after the stay should highlight high-margin add-ons and future visit incentives that are relevant to the guest profile.
Billy Richards Consulting Action Framework
Set explicit targets for direct mix by segment and track contribution after marketing and loyalty cost. Simplify the booking flow and improve room-type storytelling and imagery. Test two or three high value low cost benefits and retire those with low uptake or negative return.
Closing Synthesis and 90 Day Plan
The competitive edge in 2026 comes from integration.
Revenue science sets a profit-focused plan.
Asset strategy concentrates capital on the few moves that change rate and mix.
Artificial intelligence compresses decision time and raises accuracy.
Partnerships and licensing add high-margin revenue outside the room.
Workforce design aligns human effort with the revenue curve of the day.
Portfolio synchronization multiplies wins across markets.
ESG reduces cost and attracts premium demand.
Cloud infrastructure turns all of this into a faster, more reliable system.
Pricing governance protects contribution when pace softens.
Direct distribution improves margin and data quality for the next cycle.
The 2026 Execution Roadmap:
Q1: Audit commercial architecture, install profit-based KPIs, launch AI pilots
Q2: Scale winning AI use cases, launch partnership revenue streams, migrate priority systems to cloud
Q3: Implement ESG cost reduction programs, optimize direct channel conversion, test brand extensions
Q4: Lock 2027 capital allocation, document wins, expand portfolio synchronization
Your leadership cadence should mirror this system. Hold weekly profit reviews with forecast, mix, and labor productivity. Run monthly governance reviews for pricing, technology, and ESG. Use quarterly capital councils to decide and stage repositioning. Report to owners from a single dashboard that shows profit by segment and by channel with confidence intervals so that risk is visible and decisions are force ranked.
Use this Hospitality 2026: Twelve Strategic Shifts Driving Commercial Outperformance as your 90-day blueprint and partner with Billy Richards Consulting to bring it to life. The core framework can be live in as little as three months for many portfolios, with deeper optimization in the following quarter. We align data and decision rights, install the cadence, and equip teams to execute. You gain a clear line from strategy to contribution and from contribution to asset value.
Contact Billy Richards Consulting below to schedule a thirty-minute conversation or request a private briefing.

Written by BILLY RICHARDS
For more information, contact: